最新资源


简介
绘制条形图是一个响应和动画jQuery条形图(列)插件,用于在页面上绘制单个条形图或堆叠条形图。
基于纯JavaScript、HTML和CSS/CS3。不需要SVG和Canvas。
您可以自定义图表的几乎所有方面:通过添加轴、标签和图例来调整图表的大小、更改颜色、启用/禁用动画以及更改其外观。
如何使用它:
1.在文档中加载样式表draw-bar-chart.css和JavaScript draw-bar.chart.js。
- <!-- jQuery Is Required -->
- <script src="/path/to/cdn/jquery.min.js"></script>
- <!-- Draw Bar Chart -->
- <script src="./draw-bar-chart.js"></script>
- <link href="./draw-bar-chart.css" rel="stylesheet" />
2.创建一个空容器来容纳条形图。
- <div id="example"></div>
3.初始化插件并定义您自己的数据,以便在条形图中可视化。
- drawBarChart(
- $("#example"),
- {
- // values
- values: [3.6, 4.9, 3.8, 2.5, 6.5],
- // x-axis labels
- labels: ["jQuery", "Script", "Net", "CSS", "Com"],
- },
- {
- // chart ID
- id: 1,
- // chart title
- chartTitle: "Basic Chart",
- // y-axis title
- yAxisTitle: "y-axis title",
- // x-axis title
- xAxisTitle: "x-axis title",
- }
- );
4.也支持负值。
- drawBarChart(
- $("#example"),
- {
- // values
- values: [-1.25, -6.21, 4.04, 1.98, -2.5],
- },
- {
- // ...
- }
- );
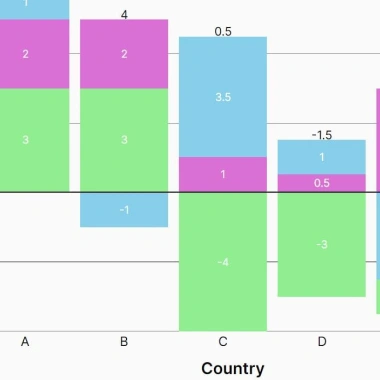
5.从数组中生成一个堆叠条形图。
- drawBarChart(
- $("#example"),
- {
- values: [
- [1, 2, 3],
- [-1, 2, 3],
- [3.5, 1, -4],
- [1, 0.5, -3],
- [-2.5, 3, -1],
- ],
- labels: ["A", "B", "C", "D", "E"],
- stackLabels: ["label1", "label2", "label3"],
- },
- {
- // ...
- }
- );
6.自定义条形图的完整插件选项。
- drawBarChart(
- $("#example"),
- {
- // data here
- },
- {
- // tick interval
- tickInterval: 2,
- // chart width
- width: "90vw",
- // chart height
- height: "90vh",
- // font size of chart title
- titleFontSize: "2em",
- // color of chart title
- titleColour: "black",
- // font size of y-axis title
- yAxisTitleFontSize: "1.5em",
- // color of y-axis label
- yAxisLabelFontSize: "1.5em",
- // font size of x-axis title
- xAxisTitleFontSize: "1.5em",
- // color of x-axis label
- xAxisLabelFontSize: "1.5em",
- // "top", "centre" or "bottom"
- dataLabelPosition: "top",
- // color of data label
- dataLabelColour: "white",
- // font size of data label
- dataLabelFontSize: "1em",
- // For single bar chart: String
- // For stacked bar chart: Array of String
- barColour: "SkyBlue",
- // space between bars
- barSpacing: "1em",
- // whether to show legend
- showLegend: true,
- // font size of stack label
- stackLabelFontSize: "1.1em",
- // color of stack label
- stackLabelColour: "black",
- // allows users to select values
- userSelect: false,
- // displays values as scientific notation
- scientificNotation: false,
- // enable/disable animation
- animationEffect: true,
- }
- );
更新日志:
2022-01-07
- 标签不够时填写堆叠的标签
预览截图
 响应式动画柱状图插件 绘制条形图